Ecommerce Metrics and Goal Setting for 2018
Clients often come to us and ask, “What metrics should we be tracking?” And we respond with a question in kind, “What are your business goals?” Here at Command C, we believe that a retailer’s goals should inform which metrics she tracks. Too often it’s the other way around; businesses start observing the data without a goal in mind. In this era of big data, online merchants can track store performance in countless ways. It can get overwhelming. Fast. With this in mind, let’s talk through the process of ecommerce metrics and goal setting for 2018.
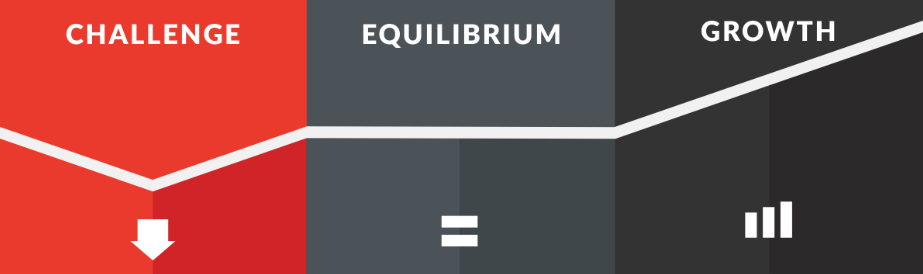
Looking to 2018, we emphasize growth for our clients. Of course most businesses want to grow, but this means something unique to ecommerce. Our industry is still relatively new. Some sites continue to deal with technical challenges like slow load times or glitches. Online businesses have to fix these issues in order to stabilize–and only then do they become ready to grow.
And when a merchant is ready to grow online, he enters a part of the retail industry that is rapidly expanding. In 2015, ecommerce represented 7% of all retail sales. By last year, online sales accounted for 9% of retail sales. Consumer demand for online shopping is increasing, and we want our clients to grab a hold of the opportunity.
To illustrate what we’re talking about, let us share a couple of sample ecommerce goals. From there, we’ll outline some metrics (or KPIs, key performance indicators) to track to measure progress towards the goals. Before we begin, remember: the goals define the metrics. Let’s take a look.
Goal #1: Ecommerce metrics to increase sales 12% in the next quarter
Let’s propose that you want to increase your online sales by a certain percentage, say 12%, in the next three months. How do you get there? First, you want to have a firm understanding of where your sales stand to date. Easy enough. Ecommerce platform dashboards display daily sales numbers. This information can also be pulled by week, month, or quarter–you name it. But now we want to keep track of these numbers, so please say this with us: spreadsheets are my friend.
Set up a spreadsheet that outlines the timing and KPIs you want to measure. Take a look at this example.
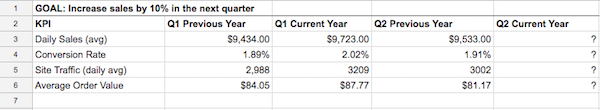
Here’s what we’re tracking with the goal of increasing sales by 12% in a quarter:
- Daily average sales: This is your daily sales, added up for every day of the quarter, divided by the number of days in the quarter.
- Conversion rate: How many of your site visitors purchased something? When someone buys a product online, it’s called a “conversion.”
- Site traffic: What is the sheer number of people visiting your site on a quarterly basis? It’s easy to pull this information from your ecommerce platform dashboard. Just be sure to record it in a tracking document, á la spreadsheet, to be able to compare this number at various times in your business.
- Average order value: When you add up the total amount purchased, divided by the number of purchases over the quarter, this will be your average order value. For suggestions on how to boost this number, check out our Top Tips.
Goal #2: Ecommerce metrics to increase site conversion rate by 1% in the next year.
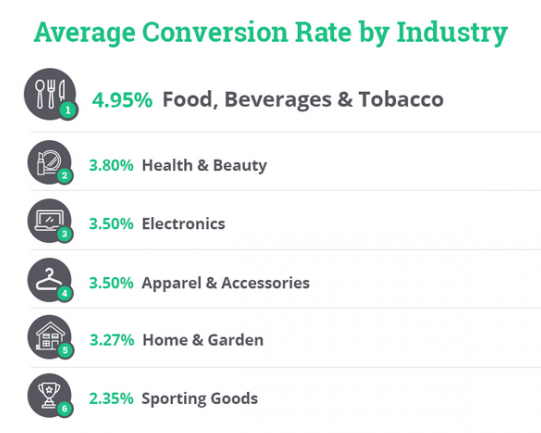
With ecommerce conversion rates, an incremental increase can really improve a retailer’s bottom line. The infograph above, courtesy of Yotpo, displays conversion rate averages by industry as of early 2017. If an online store has a 3.5% conversion rate, as shown for apparel and accessories, increasing conversions by just 1% will result in over 28% in increased sales. (1% = 28% of 3.5%.) A merchant will especially increase profit if she aims to boost the conversion rate on products with high profit margins.
For increasing conversion rates, we’d track these KPIs:
- Conversion rate: Please see above.
- Shopping cart abandonment rate: How many people visit your online store versus how many people put a product in the shopping cart without converting? The answer is your cart abandonment rate.
- Associated shipping rate trends: What’s the pricing history for the product you’re shipping? Did you convert more shoppers when it was a flat rate last quarter? Or are customers converting more when you offer free shipping at a specific price threshold?
- Competitive price trends: Looking at particular products, what are your competitors selling these items at? When they lower prices, do you see fewer conversions in your store? How else are competitors affecting your product sales?
We walk through these two examples to illustrate how setting different goals creates different KPIs to track. We know some of the information may seem basic, but we want to have everyone firmly established on the same foundation.
This article is the start of the conversion. As it’s said, knowledge is power. When it comes to business goals and KPIs, more knowledge brings more power. For instance, we like the way VWO builds the idea of “macro” and “micro” conversions in an online store. Macro conversions are largely what we’ve talked about here–someone converting to buy a product in your online store. As the name suggests, micro conversions are smaller statements, but they imply shopper intent. Examples vary depending on a business’ goals, but as examples, micro conversions can occur when someone saves a product to a wishlist or signs up for a newsletter. These actions show the customer is engaging and will likely return.
Let’s set this New Year intention together: Determine your business goals first, and then we’ll determine the KPIs to measure your progress in 2018. And along every step of the way, remember: we are in this with you.