How to Better Measure Ecommerce Conversion Rate

In discussing conversion rate optimization (CRO), there are two points that everyone can agree on. First is the definition itself of an ecommerce checkout conversion rate: it’s the number of sessions that complete a purchase divided by the total number of sessions over whatever timeframe we’re measuring. The second point of agreement is that all retailers, regardless of industry, want to improve their store’s conversion rate.
The nuance begins with how merchants measure their ecommerce conversion rate. Contrary as it sounds, you may experience a positive event with your online store – a blog post that goes viral, for example – and see a drop in your conversion rate. It’s still great news that so many people are interested in your content, but you’ll want to factor in the increased traffic as you analyze your conversion rate. Let’s dive deeper.
Site traffic and conversion rate don’t always rise together
Retail marketing teams work hard to get your company’s products and content out into the world. They want – we all want – to get as many eyeballs to your online store as possible.
With this in mind, let’s say your current ecommerce conversion rate is 2.5% with 100,000 people visiting your site. If you suddenly get 200,000 people to your site, and the conversion rate remains at 2.5%, your revenue doubles. Sounds fantastic. But it rarely happens this way. It is much more common for the new, additional 100,000 people to come to your store because of an event. As a result, they are likely to be less interested and invested in your product. They are not going to convert as much. So your conversion rate is going to fall.
First let’s step back and look at some key marketing terminology. When a visitor comes to your website, they have a certain percentage likelihood of making a purchase, based on who they are, why they’re visiting the site, their interest and familiarity with your company and products, etc. In marketing-speak, this is known as how “qualified” of a lead they are. Someone who is unfamiliar with the site / products with a low likelihood of purchase is an unqualified or low-qualified lead. Whereas a repeat customer coming back to purchase another product is a high-qualified lead. With focus and effort, store owners have the ability to influence how qualified a customer is based on their marketing efforts – both with onsite techniques and through external marketing.
Now let’s go back to that viral blog post example. In this event, your store got a huge slew of people that are coming to your site to view that blog post. But they are interested in the blog content, not necessarily your products. Compared to your normal customer base, they are low-qualified visitors. If you don’t work to convert to them, then they’re going to remain low-qualified, and will be much less likely to lead to conversions when compared to your baseline site traffic. So again, your overall conversion rate is going to fall.
How to better measure ecommerce conversion rate
As an online retailer, you need to balance your measurement of conversion rate with your measurement of the number of people on the site. If your site traffic surges, your conversion rate may very well drop unless you work to convert your new audience.
Instead of watching your store’s conversion rate as a total sum, separate the old traffic – your site’s baseline – from the new traffic. Look at the core group that would have been coming to your site anyway. Then look to your incremental visitors. Assuming their conversion rates are different, as they will most certainly be – why are they different? One way to do this in Google Analytics is to create segment filters, using criteria to identify these new visitors (ex: referral source or landing page), and use those segments to compare apples to apples, namely, existing, higher-qualified visitors vs. visitors coming for that viral blog post.
Let’s suppose that your baseline traffic has that 2.5% conversion rate. Is that good enough? If you’re happy with it, great. If not, then let’s look at what you can do to convert returning customers. Now let’s suppose that your customers are converting at a much lower rate, say 1%, for instance. That’s probably not good enough for what you’re looking for, but as long your core conversion rate didn’t change, this is all incremental revenue.
Develop a strategy to convert new visitors
When you separate existing site traffic from new visitors, ask your team, what can our company do to get these new customers engaged and increase their conversion rate? Where are they dropping out of the funnel? Where are they stopping?
Are they facing hurdles in converting? In response, could your company encourage these new visitors with a promo code? This could get them over the purchase hurdle. Are they unaware of your products because they’re landing on the blog where products are less-emphasized? Or are you setting the bar too high by requiring people to create an account before finalizing their purchase? A lot of customers will leave if you don’t offer guest checkout. Look through your analytics data, using your new customer segmentation filters, to determine where exactly in the funnel these new visitors are dropping out.
Next, analyze the pages on your site that have lower conversion rates. Then let’s determine what we can do to entice the new people that are coming to those pages. Keeping with the viral blog post example, once readers have learned what they want to in the content, they’re going to leave. To keep them engaged make sure you’re promoting your products throughout the blog post. Also, are you sharing information about your company on the blog page? What other ways can you keep these new visitors in your store? Also, at the end of the content, you want to give new viewers another opportunity to explore more, whether that’s visiting more blog posts or learning more about your products or company.
Keep in mind there’s more than one conversion rate
With conversion rate, there are several different metrics that you look at. The gold standard is completion of purchase and that’s what the core conversion rate is. But people go through several steps before the final purchase. Step one is visiting a product page. Step two is adding that product to their cart. Step three is visiting the cart page if that’s applicable to the site. Step four is going to the actual checkout. And then you have each of the steps during checkout followed by the actual purchase.
Thus it’s important for merchants to look beyond just the final conversion rate. You also want to understand where are people dropping out of the funnel in each one of those steps. Namely, are an excessive number of people dropping out in any given step?
Google Analytics doesn’t always tell the full story
All this said, the other key thing to remember is that Google Analytics is not the be-all end-all for measuring ecommerce conversion rate. Yes, it’s a fantastic tool, and your team should review your store’s analytics often. But Google Analytics doesn’t always communicate nuance, unless you spend the additional time to understand exactly what the numbers mean.
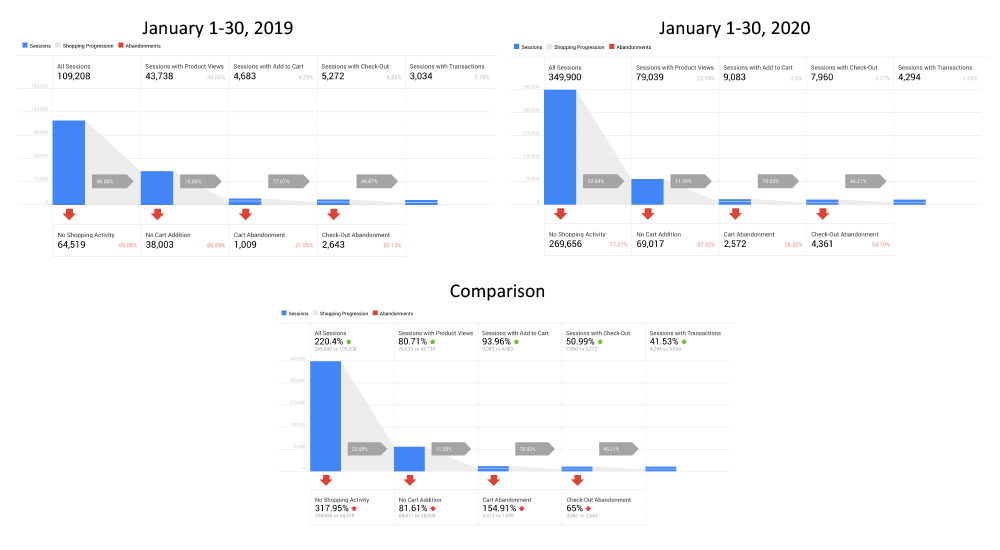
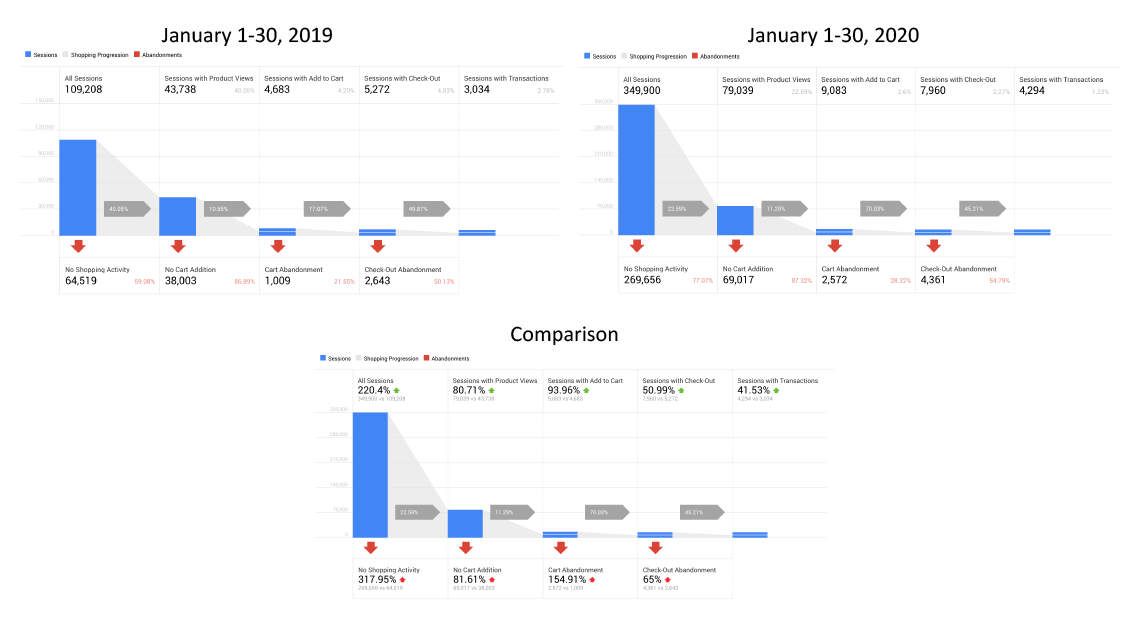
One substantial drawback with Google Analytics is when comparing the conversion funnel over time. For example, if the number of people that added a product to your cart and then went to your checkout decreased, Google Analytics is going to report this as a decrease. It will not, however, take into account if twice as many people added a product to their cart, but then one and a half times went to checkout. Google Analytics is going to count that as a substantial drop, but it’s not actually a substantial drop. It’s actually an increase, when you look at the raw numbers. (see screenshot)

Instead it’s better to take Google’s percentage change numbers and understand what they mean. In the above screenshot, Google Analytics is reporting that cart abandonment is up 154.91%. Yes, the raw numbers of people abandoning the cart went from 1009 to 2572, which is a large increase. However, there was also a large 50.99% increase in customers who proceeded to the next step. Even though those large percentage decreases may look bad, it doesn’t necessarily mean it’s bad for your site. It just likely means that the site has experienced a dramatic increase in visitors, and there’s an opportunity for improvement with the new subset of customers that caused that change. It could actually mean things are really good for your site, because so many more people are visiting the site – and finalizing their purchases.
Remember: the raw numbers may tell one story, but it is important to take the analysis to the next level. Retailers can do this by using segmentation filters, or understanding the reasons behind the changes, to determine what the numbers mean and what is the best action to take.
