2018 Holiday Ecommerce Planning: Leveraging Last Year’s Data to Boost Sales
As you intensify your 2018 Holiday ecommerce planning, it’s important to stay mindful of the evolving customer expectations for this year. At the same time, while ecommerce grows and shifts, the fact remains that the holidays are the most important time of the year for the majority of retailers.
This post is inspired by Magento’s webinar, Amplify Your Holiday Sales by Leveraging Shopper Data. It’s packed with great information, and we’ll share a lot of it here. For starters, consider these stats: retailers on average make 20% of their annual sales during the months of November and December. Further, in the five days between Thanksgiving and Cyber Monday, merchants earn 20% of their holiday revenue. The holidays are also when most retailers get 25% of their annual new customers.
Think of it as the season for retail alchemy. Merchants can take their best year-round practices and refine them into gold for the holidays. In 2018, a big component of this is understanding your customer data. Let’s take a look.

What happened in 2017?
You probably did a deep dive into your Holiday 2017 customer analytics as you planned your KPIs and goals for 2018. Now as we head into Holiday 2018, it’s time to revisit the notes on Holiday 2017. Review the data from your site, from November and December in 2017, and determine the answers to these questions:
- How much revenue did my site generate last year during these two months?
- What was the average order value?
- Looking at my annual sales, what percentage of sales did the holiday season account for? (It averages 20%; however, industries vary. For instance, the jewelry business tends to earn closer to 30% of its annual sales during the holidays.)
- What percentage of Holiday 2017 revenue came from new customers?
- How did my site acquire the new customers?
- Which new customers from Holiday 2017 returned and purchased again?
- What is the CLV (customer lifetime value) of my holiday shoppers over the past year?
- And does the CLV vary by acquisition source, i.e. an Instagram shoppable post vs. direct email campaign?
Turn to the Data Dashboard
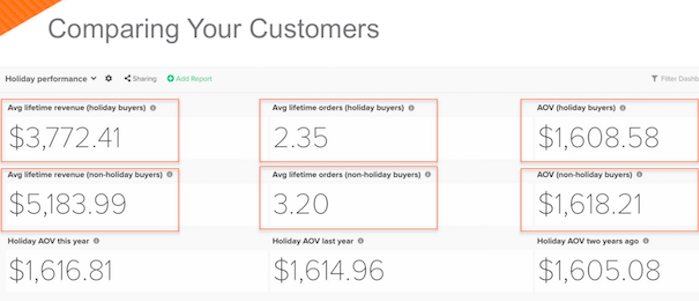
Take a look at the snapshot above of a Magento dashboard showing a retailer’s holiday performance. (Note: Shopify also has an excellent suite of data tools for the holidays.) Retailers on updated versions of both Magento and Shopify can generate a dashboard report similar to this.
Here Magento is comparing the retailer’s holiday buyers versus non-holiday buyers in terms of average lifetime revenue, average number of lifetime orders, and average order value. In the example they’ve given, the non-holiday buyers show stronger value than the holiday buyers. But, again, over the holidays, retailers acquire approximately 25% of their new customers for the year. So how can merchants get their holiday shoppers to convert again during another time of year?
Look to customer acquisition ROI
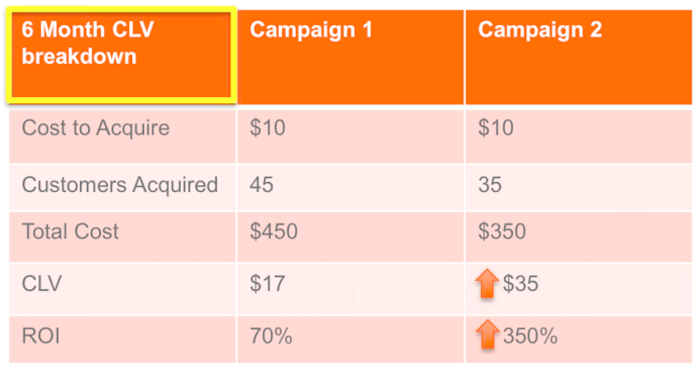
Consider the example of two different marketing efforts: an Instagram shoppable post versus a direct email campaign. Let’s say in each effort it cost $10 to acquire one new customer. The Instagram shoppable post brought in 45 new customers, and their average order value was $20. The email campaign resulted in 35 new customers, and their AOV was $18. At first glance, it looks like the Instagram shoppable post is the most profitable.
Next let’s suppose that only five customers from the Instagram post came back since the holiday season and purchased again. But 17 customers from the direct email have returned and purchased more. The repeat purchases boost the customer lifetime value of the direct email campaign, and thus, increase the return on investment for this way of acquiring customers.
Before the holidays kick into gear, take the time to review the customer lifetime values of the shoppers who purchased with you in Holiday 2017. You have may sensed a campaign was really successful last year, but how did it hold up over the following months? You might be surprised to learn another approach actually did better over the course of time. If that’s the case, then you know where to focus your marketing resources for Holiday 2018.
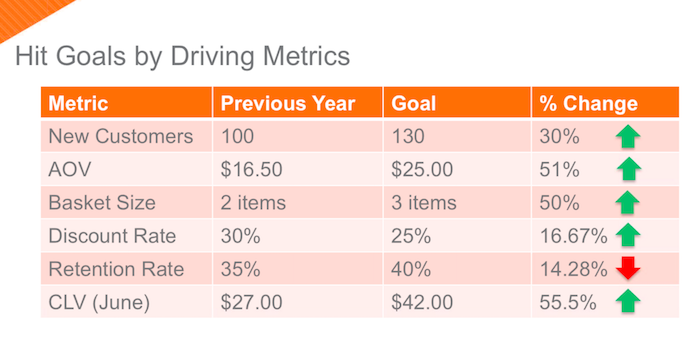
Use 2017 data to set 2018 goals

On a final note, your customer data from Holiday 2017 holds the potential to unlock greater sales and profit for the upcoming holidays. Use the data as your benchmark. If you had 100 new customers last year, how many can you attract this holiday season? Using the example above, if your AOV was $16.50 last year, can you go for $25 this year? If you decide to strive for an AOV of $25, what do you need to do to get there? Should you consider a higher free shipping threshold? Or are there product bundles that you could offer?
Whatever your holiday sales goals may be, start with last year’s data. Know who your customers are, where they came from, and what they purchased from you. When you have this information, you’re able to build upon a great thing. Experts predict that Holiday 2018 ecommerce sales will grow 15.5% over last year. Now let’s make sure your retail business is fully engaged with this momentum. Last year’s data will help get you there.