Identifying Low Hanging Fruit with Great ROI Using Google Analytics
You can spend hours digging around your store trying to find bugs and pages that break. But it’s a fool’s errand to jump into a site without knowing where to look first.
Google Analytics is the map that can pinpoint where your site could be breaking, loading too slowly, or is not matching with customer expectations.
In this article, you’ll learn how to use Google Analytics to:
- Identify pages that could be broken
- Find browser versions where the site could be experiencing technical issues
- Spot spam traffic that you need to block
- Locate pages that need speed optimizations
Landing Page Issues
Landing pages are going to be your customer’s first interaction with your site. Many things can go wrong when you’re trying to make a good first impression.
- Images may not load properly or take too long
- The page is slow to load on a particular device type
- The landing page isn’t relevant to the ad messaging
- There are technical bugs leading to poor usability
First, you want to create a custom report to look at the landing pages with high bounce rates and/or low conversion rates. This will tell you the pages you should look at first on your site, to see if you can identify any obvious issues. A product page with consistent 0% conversions could mean the item is out of stock (so traffic needs to be stopped) or there could be a bug where visitors can’t even add the item to their cart.
Next, you’ll want to look at the traffic going to these problematic landing pages. It could be that the messaging in your ads is not relevant to what’s on the landing page. A landing page talking about the fashionability of a pair of sneakers is not relevant if someone comes from an ad with messaging conveying that the sneakers are waterproof.
To create this landing page report, see the screenshot below:
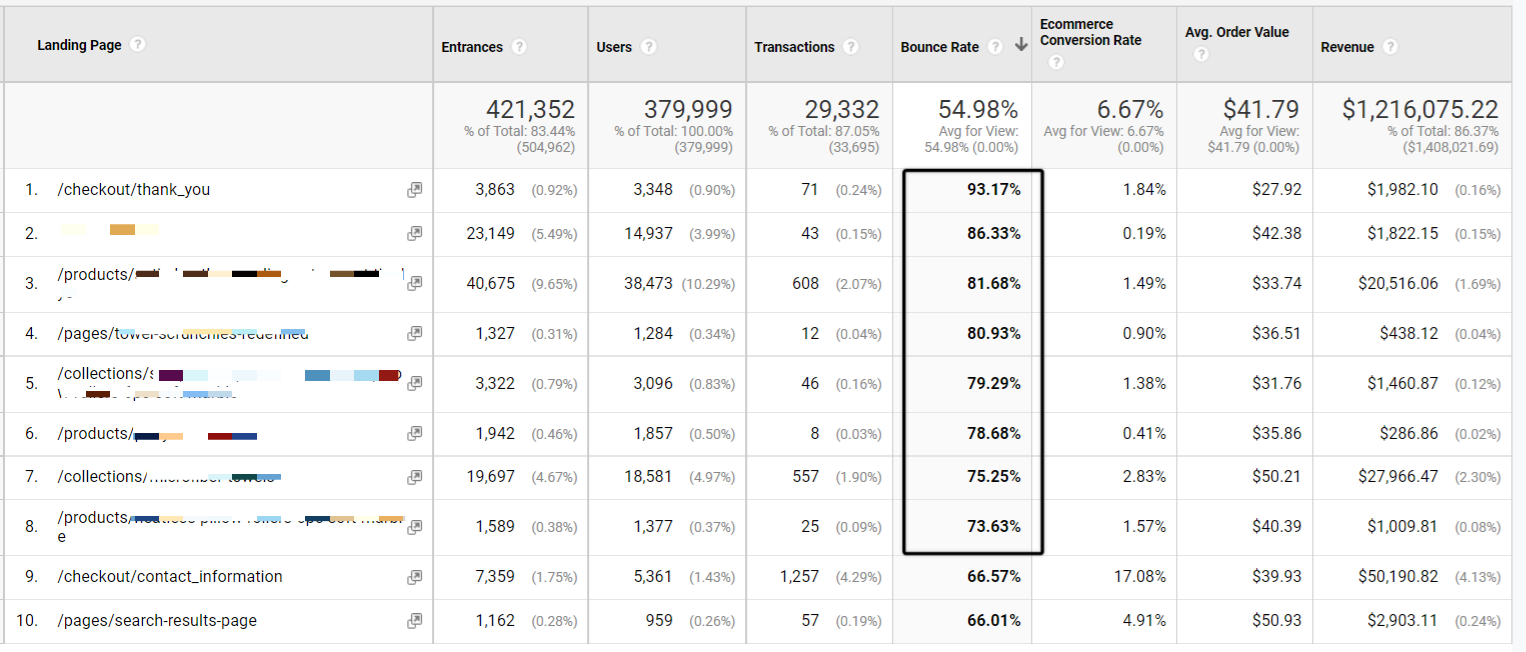
This particular report is looking at landing pages with more than 1,000 entrances and sorts bounce rate high to low.
The first page is the thank you page with a bounce rate over 93%, but this is not too surprising as people often leave the thank you page. What’s odd is this is being considered a landing page, when people shouldn’t be landing there.
We can see a variety of other pages with very high bounce rates including collection, and product pages. It’s important to dig into these and see if anything is wrong on those particular pages.
Then you’ll want to run this same report but for ecommerce conversion rate low to high.
Traffic Issues
When it comes to traffic, we’ll want to look at a few reports, but mainly focusing on paid traffic. The last thing you want to find out is that you’ve been spending money on a campaign that is sending money to a broken page.
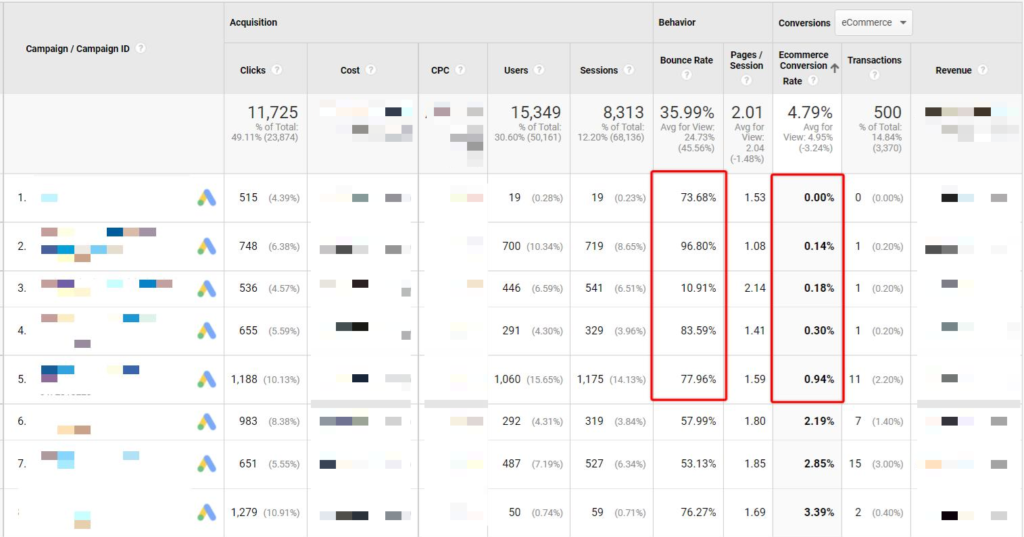
First, you can look at the Google Ads report, focusing on the campaigns. Look just at campaigns with a decent number of clicks, say 500 to 1000, and then sort by conversion rate low to high.

If we look at this sample report, you can see there are 5 campaigns that have conversion rates under 1%. They also have very high bounce rates.
The third campaign looks suspicious, as it has an extremely low conversion rate but a bounce rate of just 10.91%. A very low bounce is not always a good thing, as it can indicate a tracking code or other issue.
The number two campaign in the list has a bounce rate of 96.8%! That’s extremely high and can definitely point to a problem with the ad campaign, targeting, or website.
Indicators like this are something that won’t tell you what’s wrong with the campaign, but can tell you that there might be something wrong. And if there’s really nothing obviously wrong, it could mean it’s just an unprofitable campaign that should be turned off.
Aside from Google Ads, you’ll want to look at reports containing your other paid ads. You’ll have to ensure your paid traffic is properly tagged with UTM parameters. This way you can look at the performance of particular campaigns.
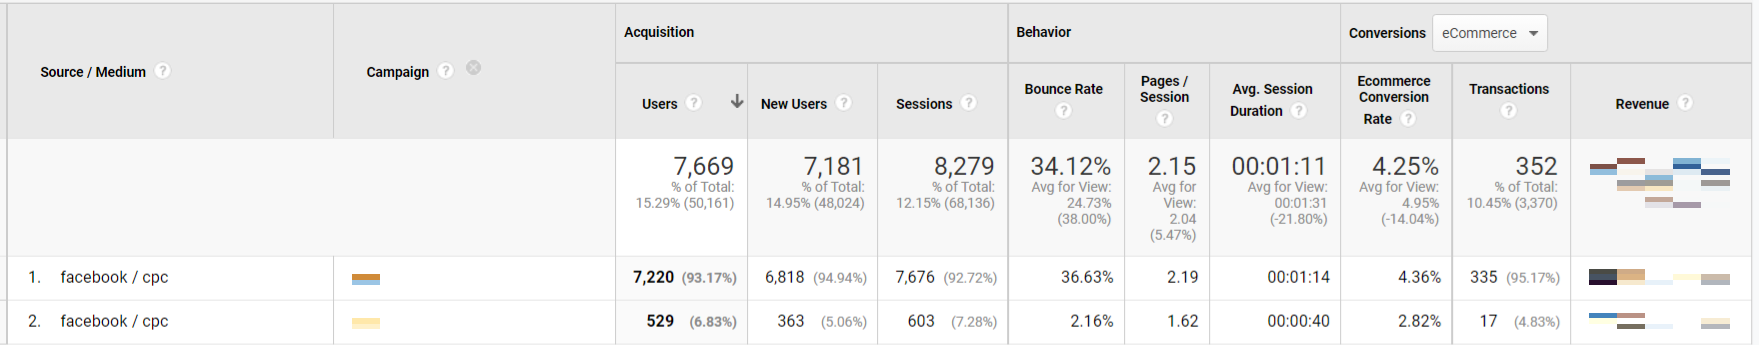
Looking at Facebook traffic (secondary dimension of campaign), we can see that there isn’t anything performing too bad. But the second campaign does have an extremely low bounce rate, which indicates there might be something wrong with a tracking code, event, etc.
Device & Browser Issues
An important report to create is one that breaks down traffic by device type and browser version. When Chrome, Apple, or another company issues a new browser update it could lead to things breaking on your store.
For example, iOS 15 led to a new version of Safari which featured the URL bar (typically at the top of the screen) to be shown at the bottom. This meant that visitors with “sticky” elements at the bottom of their site needed to make sure that these still functioned properly with this new release.
Looking at this report in Google Analytics can help identify major breaks in the site that are occurring due to a specific browser or browser version. It can also indicate potential spam or bot traffic. This is often seen in old browser versions with extremely high bounce rates (nearing 100%) and very low conversion rates.
Make sure to look at browsers and browser versions by device type. It wouldn’t make sense to look at Chrome overall, when Chrome is very different on mobile, desktop, and tablet.
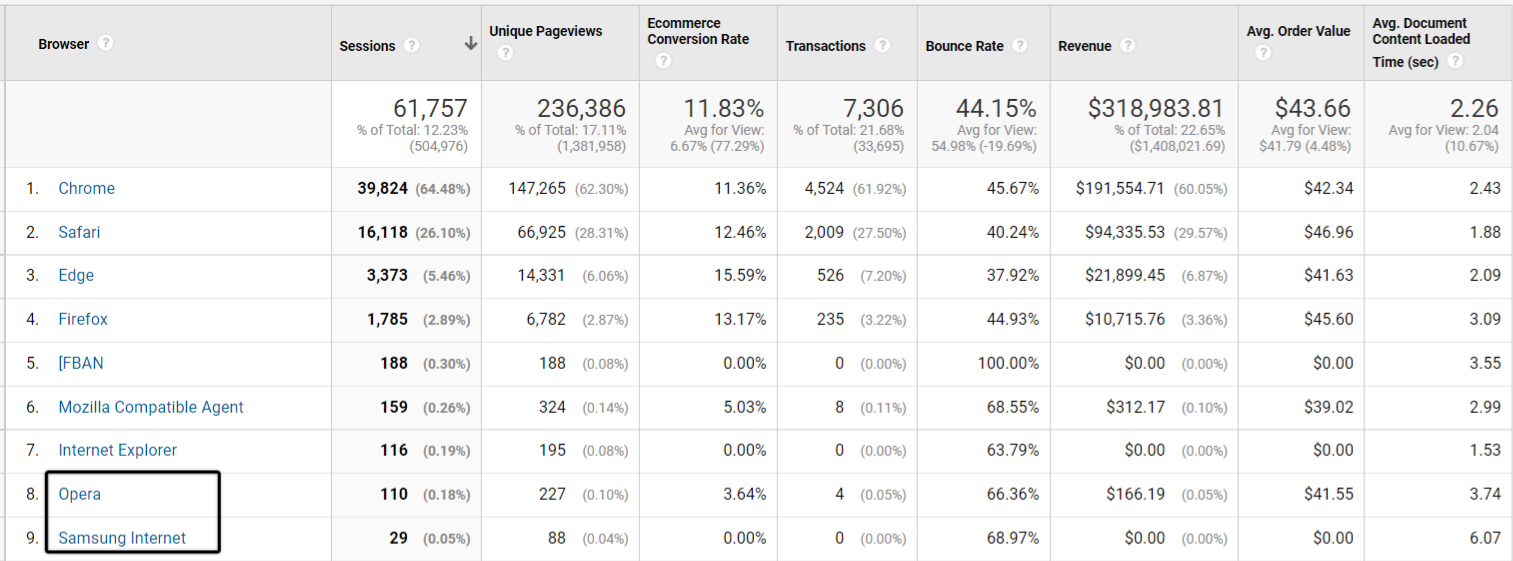
In this report, we are looking at desktop browsers. We can see there are a few browsers with a low amount of sessions and 0% conversion rates. These are FBAN, Internet Explorer, and Samsung Internet. Internet Explorer has been discontinued. FBAN is a Facebook browser.
Although there’s not anything obviously wrong in this report, you can see that Opera has a 3.64% conversion rate compared to the average of 11.83%. It does not have many sessions, but if it did have more sessions, this low conversion rate would be an indicator of a potential bug or break in the site due to how the store displays in that particular browser.
Spotting Speed Issues
The last report to look at is in regards to speed. Store visitors, especially on mobile, are not ones to wait. If they click an ad to go to your store and it takes too long, they’re onto the next thing. You want to ensure your entire site, as well as certain pages and page types are loading fast.
Any easy improvement in conversion rate can be had if your store loads slowly and you can decrease that load time.
A useful metric to look at in Google Analytics is Average Document Interactive Time. This is the time it takes until a page is loaded enough to where a user can interact with it. The aim is to get pages loading at least under 3 seconds, over 3 seconds is much too slow.
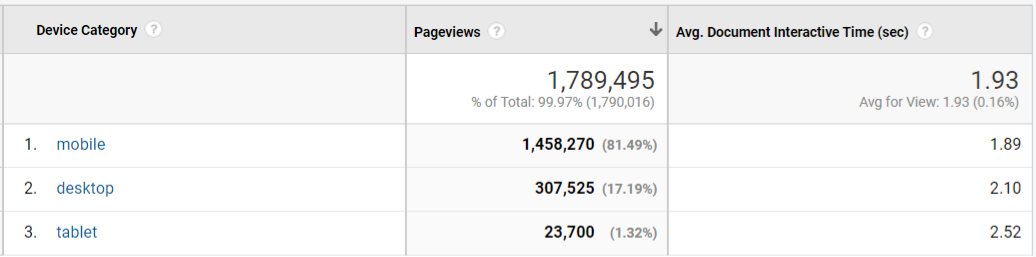
Looking at this report, the speeds are quite good for each device type, but that doesn’t tell us the whole picture. Overall a device could be loading fast, but there might be individual pages with a lot of traffic or certain page types that are loading slowly.
Next, we want to look by device type at the pages, especially those with a lot of pageviews and slow loading times.
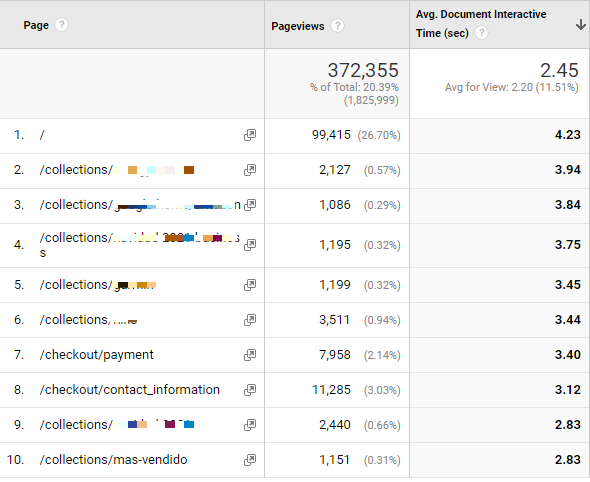
This report looks only at mobile pages with over 1,000 pageviews and ranks from high to low Avg. Document Interactive Time. It’s not worthwhile to look at a page with 50 pageviews, even though it may be loading slowly. We want to focus on the biggest impacts first.
We can see that clearly the homepage is the spot we want to focus speed improvements on first. The homepage is seeing over a quarter of all mobile traffic and is loading at 4.23 seconds which is very slow. The other pages to look at are the 5 Collection pages and then the 2 checkout pages.
This type of report can really help you hone in where you can make the biggest impact when it comes to sitespeed. Rather than trying to improve it sitewide, you can first focus on the slowest loading pages with the most traffic. You can use tools like Google’s PageSpeed Insights in order to see where you can make improvements.
What’s Next?
The custom reports we showed you should be revisited at least monthly, to make sure you’re not missing any obvious technical issues or bugs.
It’s likely you won’t find any bugs at all, but getting into the habit of checking on a regular basis means you can spot things early if they do happen.
Whenever new browser versions or popular devices come out, it can be helpful to check Google Analytics to see if there are obvious dips in performance on those new technologies. If so, it can be worthwhile to test your website using a browser and device testing software to ensure there are no breaks.
Set up these reports and see what you can find out about your site.